Logins
20.5K
+4%
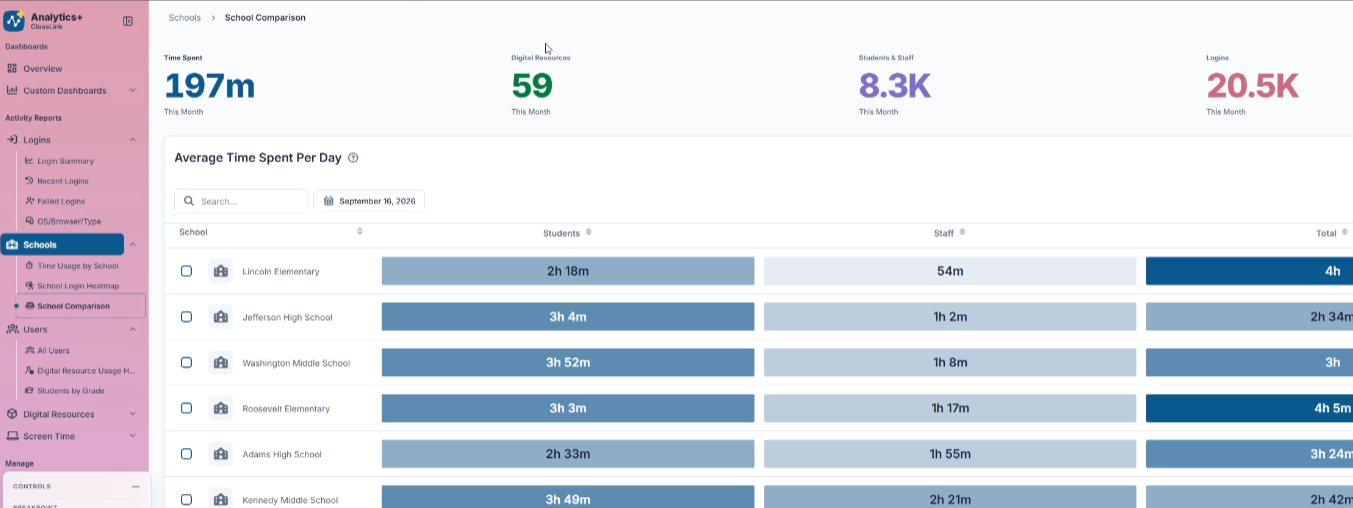
Four current screens from Analytics+ and the subscriptions view, a stack of boarding-pass redesigns as inspiration, and the question: what would we change? This page is a working exploration for Chris, not a team artifact. Nothing here is accepted into Frost.
Tokens are read from the UX_tools remote (origin/main at 2f75211). Where the page goes beyond Frost's current type ladder it says so with an outside Frost tag. Fixture data only: school names come from the existing screenshots and every number is invented.
The screens are competent. The problems are all about hierarchy and color doing the wrong job.
Seven moves show up across the redesigns. Each maps directly onto a data display.
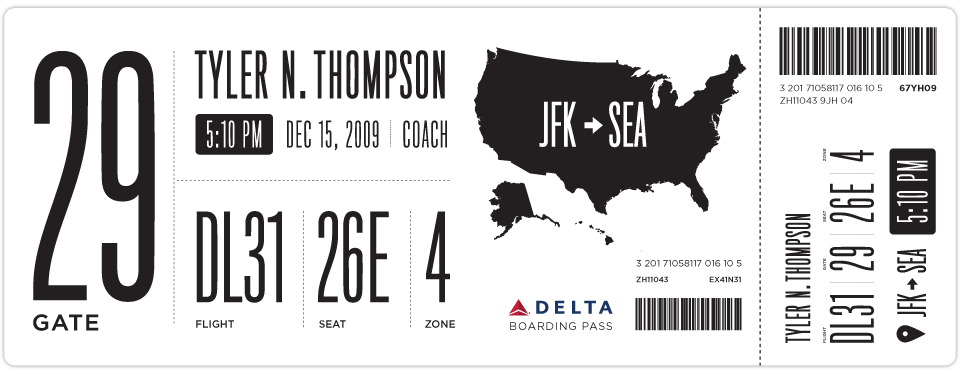
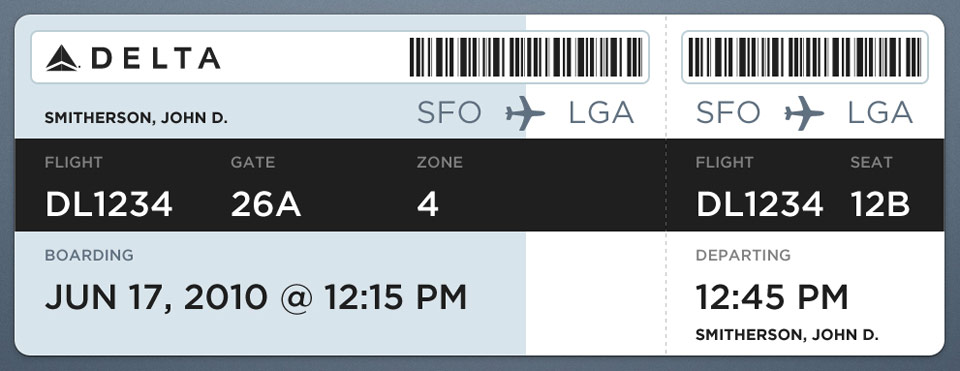
Thompson's final Delta pass gives the gate number a quarter of the card. Everything else is legible but secondary. Hierarchy comes from size, not color.
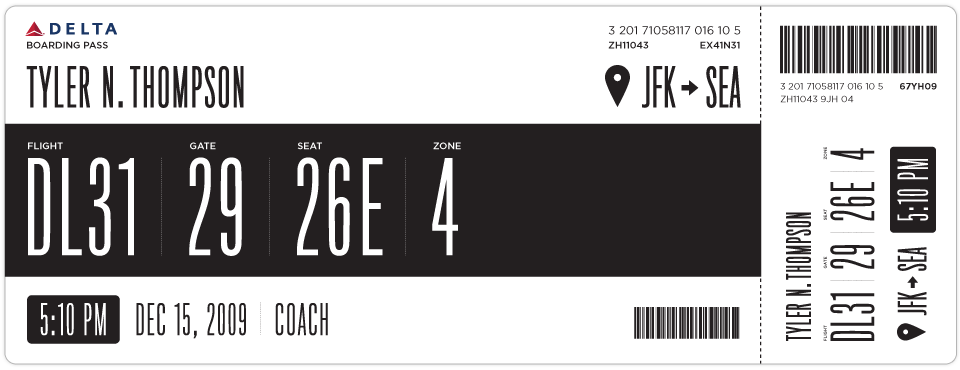
Small tracked label, big numeral, repeated as a rhythm across the band. Once you learn the shape you never re-read a label.
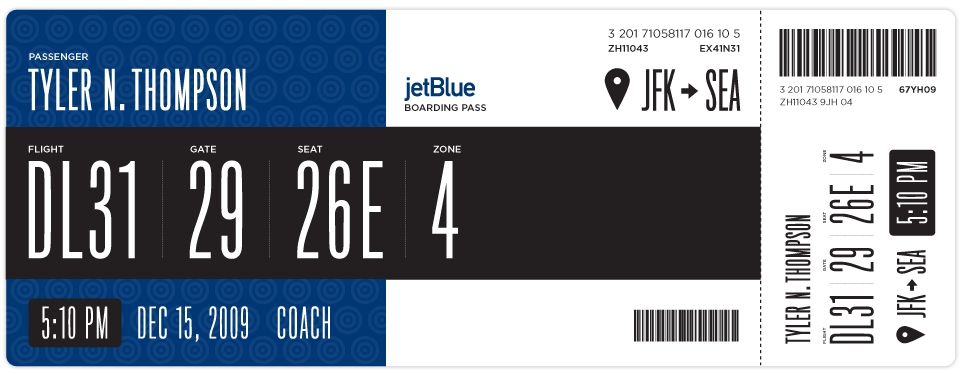
The brand panel changes color across the Delta, JetBlue and red variants. The data band stays black on white. Color is identity or the one thing that matters, never a code for values.
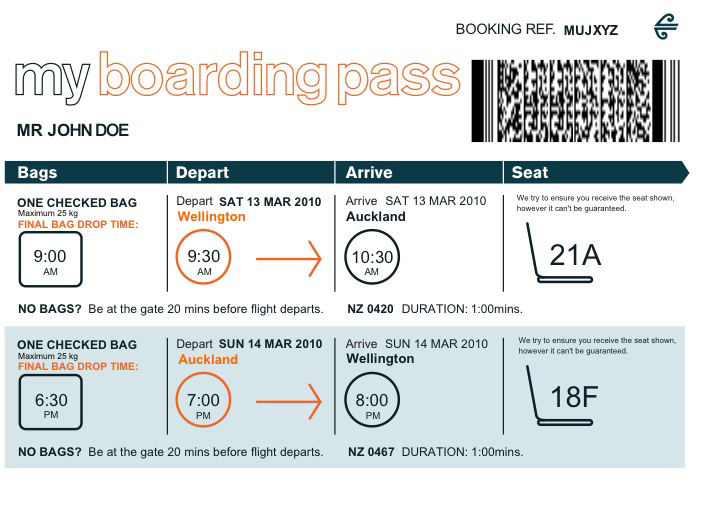
Pete Smart's principle: gate before seat, because that is the order you use them. The Air NZ pass turns the trip into a left-to-right strip of stations.
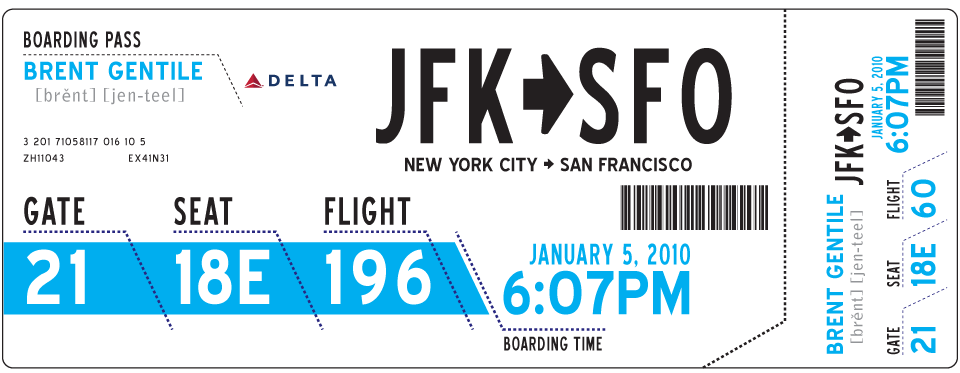
"JFK → SFO" is a story, not two fields. Gentile sets it as the headline and the reader knows the trip before reading a single label.
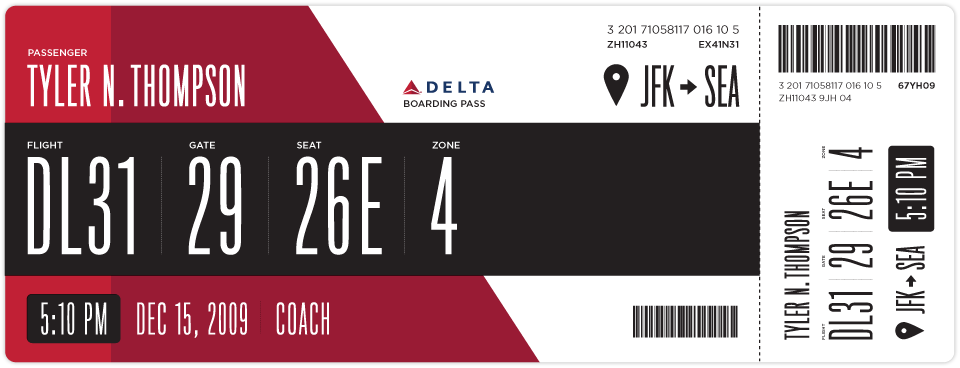
The tear-off repeats the headline facts in a compact strip. When the main pass is gone, the stub still tells you where to sit.
Barcodes and record locators shrink and move to the margins. They are still there for the scanner; they stop competing with the human.
Four "this month" figures from Analytics+. The job is to say what happened this month at a glance and lead with one number.
Both current treatments, redrawn. Top: the older colored-numeral row. Bottom: the newer icon-tile row. In both, four equal weights and four decorative colors.
What changed: one qualifier for the whole band instead of four. "Time spent" leads because it is the metric the other three explain. Each delta names its glyph so the direction never rides on color alone. The unit rides inside the numeral, at half size, so "197m" stops reading as "197 meters". Motion: each figure rolls to its value, upward where the metric grew and downward where it fell, settling one digit at a time from the left. "Digital resources" did not change, so it does not move.
What changed: numerals in ink, one at the ladder's 54px in primary, three at 34px. A twelve-point sparkline in --bar-soft with the current period in --bar gives the number a direction without an axis. Delta color is opt-in per metric (here off), the glyph is mandatory. The icon tiles are gone: an icon next to a labeled number is a second label. Motion: the same roll, with the sparkline drawing in behind it.
The passes get their voice from condensed grotesks. Frost's ladder sets the stat numeral in Inter 800 with tight tracking. Three candidates at the same 54px, in the current theme:
Use the "Numeral face" switch in the left rail to apply any of these to the whole page. My read after building: Inter 800 is the safe Frost answer and looks heavy at 54px next to 14px Inter body. Barlow Semi Condensed 600 keeps Frost's humanist feel, saves about 18% width in a band, and is the one I would propose if we add a numeral face. Full Condensed is the boarding pass, and reads as a different product. Chris chose Barlow Semi Condensed 600 on 2026-09-18; it is now the page default.
Average time spent per day, six schools, three measures. The job is to find the high and low schools and read an exact value when you need one. Eighteen cells: precision matters more than pattern.
| Name | Students | Staff | Total |
|---|
Redrawn with the source's shading logic: every cell filled, intensity per column, white text throughout. Hover nothing: there is no legend, no maximum and no tooltip.
What changed: a bar never travels without its number, the header names the maximum so the bar means something, and a text summary ends every row so nothing rides on the bar alone. Bars are 6px on a --bar-soft track (fill on track measures 3.14:1). Sortable by any column; the annotation restates the sort.
What changed: the quietest possible table. It wins when readers mostly want the exact numbers and only sometimes want the outliers. It loses when they want to see the shape of the whole column, which the bars give for free.
What changed: one hue, light to dark, five bins with a legend that says so. The lightest bin recedes toward the card on purpose (near-zero should look like near-nothing). Text switches to white only on the two darkest steps, so every value clears 4.5:1. This is the treatment to reach for at 7×7 and up, where bars stop fitting. At 6×3 it is decoration; A is the better answer.
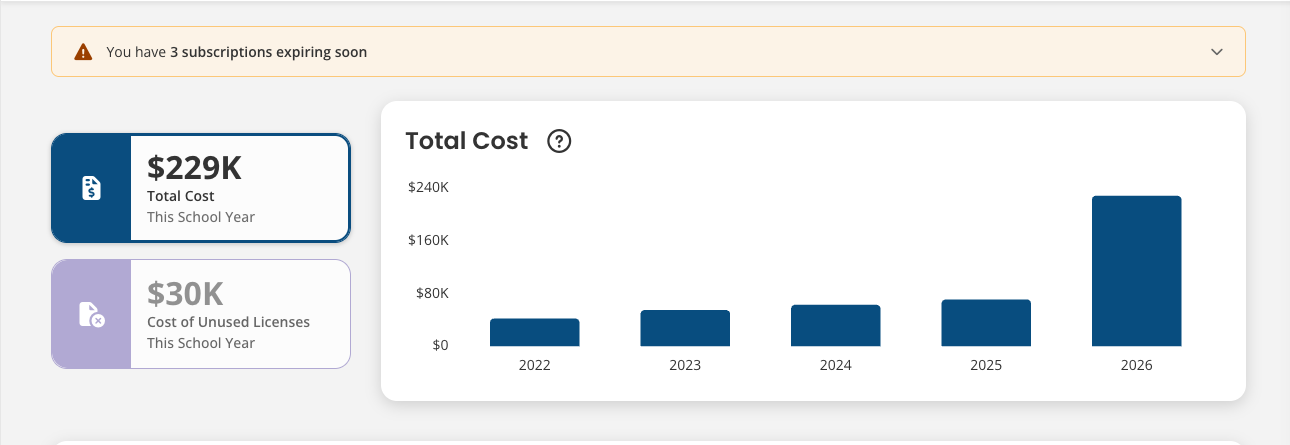
Total subscription cost per school year, unused-license cost, and three subscriptions about to expire. The job is to say what this year costs, how that compares, and what needs a decision.
2026 is nearly triple 2025. Four years of steady growth, then a step.
| School year | Total cost | Change |
|---|---|---|
| 2022 | $40K | — |
| 2023 | $52K | +$12K |
| 2024 | $65K | +$13K |
| 2025 | $78K | +$13K |
| 2026 | $229K | +$151K |
What changed: the hero is the number the page is about, so it is the only colored numeral. Prior years step back to gray and 2026 takes the bar color, with the only direct label. Bars are 24px wide with hairline gridlines. The banner keeps Frost's warning surface, the K3 glyph and role="status", adds the dollar amount so the reader can weigh it, and links to the list. It deliberately has no edge treatment because K4 is still an open decision. The "unused" stat becomes a meter so 13% reads as a share, not a second headline. Delta color here is opt-in and on: on a cost, up is bad. Motion: the bars grow from the baseline left to right, the $229K label lands only once its bar has arrived, and the meter fills to 13%. The hero rolls up, because the cost grew, even though growing is the bad news here: direction reports the number, never the judgment.
Total subscription cost · 2025–26 to 2026–27 · up $151K
What changed: no chart. The five-year bar chart was only ever saying "2026 jumped", so the pass card says it as a route: $78K → $229K. The three rows are the reasons behind the jump, each with its amount, and the stub repeats the counts. This is the most opinionated of the after-states and the one most worth a reaction: does a district admin miss the bars?
The before/afters above are components. These are the pages they add up to. Each is the Analytics+ overview and the subscriptions view seen through one lens. All three carry the same motion: figures roll in the direction the metric moved, bars grow from the baseline.
Daily time per user · Jefferson to Roosevelt
Subscription cost · up $151K
Where it shines: a district admin's morning glance. Everything is a fact with a label; nothing needs decoding. Where it strains: trend shape. The Pass has no room for a sparkline or a distribution, so "is this normal?" needs a click. It is a summary layer, not an analysis layer. What it would take in Frost: a stat band recipe (ink band, hero cell, dashed cell dividers), a route component, and the stub column. The ink band is the one new surface.
Grade 3 spent the most, 18 minutes. Grade 4 the least.
| Grade | Minutes |
|---|---|
| K | 15 |
| 1 | 14 |
| 2 | 11 |
| 3 | 18 |
| 4 | 7 |
Where it shines: it is the same Frost card everyone already knows, so it costs nothing to adopt, and it scales from four tiles to forty rows. It is also the direction that becomes design-system guidance most directly, because every move is a rule: one hero, gray context, bar plus number, one sentence. Where it strains: it is quiet. On a screen with six charts nothing pops, which is the point, but stakeholders used to color may read it as unfinished. What it would take in Frost: a stat-tile recipe, a chart-card recipe, the §6 bar recipe promoted, and the emphasis rule written down.
Where it shines: it answers "what do I do?" before "what happened?". The alert stops being a banner and becomes the first section with its own facts. Ranking by change surfaces Roosevelt's jump, which the flat table hides. Where it strains: the strip only works for a handful of ordered periods and cannot show magnitude honestly (the $229K station is the same size as $40K, only the ring says "now"). Past six periods it should be a bar chart again. What it would take in Frost: a page-order rule (decide → changed → detail), a ranked-list recipe, and the station strip as an opt-in for five or fewer periods.
Frost ships nine categorical chart colors with no ordering rule and no contrast ledger. I ran them through the dataviz validator (OKLab color-vision simulation, lightness band, chroma floor, contrast). Results, not opinions.
--chart-1..9, light on whiteDark mode fails the same checks (eight of nine outside the lightness band; adjacent pairs at ΔE 6.5 and 11.9). Even the best three-color subset (1, 3, 4) fails all-pairs: blue and violet sit at ΔE 4.6 under deuteranopia.
A sequential ramp for heatmaps and an ordinal ramp for discrete ordered marks, both from Frost's own blues. Light-end contrast is the check most candidates fail: --bar-soft at 1.40:1 cannot start an ordinal ramp.
Two of the four ordinal steps are existing Frost tokens (--cl-blue-500, --cl-blue-700). The sequential ramp's first bin is --cl-blue-tint, allowed to recede because a continuous scale's near-zero may look like near-nothing.
What this means for the rules: the categorical palette is fine for a legend-plus-label chart with two or three series and becomes unreliable past that. The safe default is one hue: --bar for the series that matters and --chart-9 gray for context. That is the Quiet Emphasis concept, arrived at from the numbers.
Chris chose Quiet Emphasis and Barlow Semi Condensed on 2026-09-18. The Pass and Sequence stay on the page as considered alternatives; two of their moves survive as rules inside Quiet Emphasis.
Every chart and table on every dashboard. One hero, gray context, bar plus number, one sentence per chart, a table twin. The quiet tiles in §3 After B are the KPI recipe. Becomes Frost guidance with the least new surface.
Stat sizes only, 34px and up: hero figures, stat-tile values, route figures. Inter stays for body, tables, axis ticks and labels. Proportional figures on standalone numbers, tabular in columns. Needs a Frost token (a display numeral face) and a Design.MD §5.1 amendment.
From Sequence: alerts sit beside their evidence and name the count and amount. From the Pass: label above value, one hero per view. The ink stat band, route sentences, stub columns and station strip are not carried forward.
Label above value, 11/700 with .02em tracking in muted ink. Value in foreground ink; exactly one hero per view at 54px in primary. One size per band, set by the widest value. Qualifier once per band, not per tile. Optional delta: signed, vs a named period, glyph mandatory, color opt-in and set by whether up is good. Optional twelve-point sparkline in --bar-soft, current period in --bar.
Frost card recipe. Title at H1 (20/600), a one-sentence finding in body ink under it, filters in one row above every chart they scope, never inside the card. Every chart ships a table twin behind a "Table view" disclosure. Hover tooltip on every bar and cell; the tooltip never gates a value.
One series is --bar. Context series (prior periods, other rows) are --chart-9 at 85% opacity (3.2:1 on the card, so the context bars still clear the 3:1 non-text floor). Bars are at most 24px wide, 4px radius on the data end, square at the baseline, with a hairline solid grid. Direct-label the one bar the sentence is about; the axis carries the rest.
6px track in --bar-soft, fill in --bar, the number at 52px right-aligned tabular beside it. The column header names the maximum. Each row ends in a text summary. A bar never travels without its number.
explorations/tables Part 1 §6 unchanged, plus the row summary.Only at 7×7 and larger. One hue, five bins, a legend that says "five bins per column", ink switched to white on the two darkest steps only, a row summary in text. Bins per column unless the columns share a unit and a scale.
Up to three series from --chart-1..9, always with a legend and a direct label, since the palette does not pass color-vision separation on its own. Past three: small multiples or fold into "Other". Never a value ramp on nominal categories.
Barlow Semi Condensed 600 at the stat sizes only (34px and up), never in body, tables or axis ticks. Inter stays everywhere else. Proportional figures on standalone numbers, tabular in columns. Load weights 500–700 only.
--font-numeral; ladder change: stat numeral 54/600 in Barlow Semi Condensed, tracking −.01em.A figure rolls to its value: upward when the metric grew, downward when it fell, still when it did not change. Direction reports the number, never whether the news is good. Digits settle left to right, 880ms plus 130ms per digit, easing hard at the end. Bars grow from the baseline with a 70ms stagger; a direct label appears only after its bar lands. Each element animates once, when it first scrolls into view, and never on a filter change. prefers-reduced-motion renders every final state with no movement at all.
An alert about data appears beside the data: the banner names the count and the amount and links to the list, and the affected mark carries a glyph. Frost's five-severity ladder, K1 pairing, K3 glyphs and K5 roles apply unchanged. No edge treatment until K4 is decided.
ds-contribute intake for the stat-tile and chart-card recipes plus the numeral token, or a protoapp pilot on one Analytics+ screen first?Design.MD §4.9, §5.1, §5.3, §9, §11; Frost/design-system/FROST-SUITE-ALIGNMENT.md §D1, §K; Frost/explorations/tables/DECISIONS.md Part 1 §3 and §6; the dataviz skill's form, mark, interaction and anti-pattern references and its palette validator.